Overview
Despite the rise of web-based report interfaces and dashboards, Excel remains the tool of choice in many settings. However, the world of Excel is very separate from the world of most developers. As a result most programmatically generated Excel reports either have very poor data presentation or they are very brittle.
In this post, I’ll present a solution to this problem in Clojure, but first I want to review why we should embrace Excel rather than run from it and to discuss the current state-of-the-art in Excel reporting from live systems.
TL;DR: The excel-templates project allows you to create Excel workbooks from Clojure data structures where rich formatting is provided by another Excel workbook that acts as a template. The method this uses is inspired by the technique used by Enlive to generate HTML files from template files.
To jump right in and use excel-templates, follow the instructions in the README file.
Why Excel?
Often developers are forced to do reporting in Excel because “the business users require it.” Without understanding what makes Excel a compelling platform, this becomes the programming equivalent of eating your broccoli.
Let’s consider what makes Excel awesome.
The most compelling thing to me about Excel is this: when you deliver an Excel workbook to people, you give them a live, malleable document. It is easy for the receiver to instantly start to interact with the data you’ve given them in ways of their own choosing. This includes creating derivative products, combining and comparing your data with data from others, visualizing the data in the form they wish, etc.
Excel documents can also be transparent. By including formulas in your spreadsheet rather than simply generating numbers in a report, the relationship between various quantities can be visible and explicit.
Finally, Excel has a rich set of formatting choices which can be applied interactively. Want this column to be dollars and cents while that row has totals in bold? Piece of cake! Want to group related columns together using common background colors? No problem! Add a text box explaining how a field is defined? Easy!
All of these things are possible on the web and in other environments, but they all require professional programmers to build solutions and they rarely come close to supporting the level of end-user self-service that Excel does.
Not that Excel doesn’t have its downsides. Logic that controls the enterprise is locked away in spreadsheets where it can’t be seen or understood (see “Microsoft’s Excel Might Be The Most Dangerous Software On The Planet,” for example). Excel’s file format and development environment are effectively immune to the tools of modern software development. And the collaboration story continues to be mostly based on emailing spreadsheets around (or on the dreaded Sharepoint).
Although we acknowledge these negatives, we shouldn’t let them blind us to the power Excel still has as a tool for communicating quantitative information.
For more on why developers should love spreadsheets, see Felienne Hermans’s excellent Strange Loop presentation, “Spreadsheets for Developers.”
Ways to Generate Excel
So what are the common ways to do reporting via Excel? Let’s look at each of them along with their advantages and disadvantages.
Use VBA to Dynamically Add Data to a Spreadsheet
Excel’s built-in programming language, Visual Basic for Applications (VBA), has interfaces to pull data from external sources such as databases or web sites. By writing a VBA program, an analyst can make the spreadsheet itself into a self-generating report.
Advantages:
- Reports can be built by analysts themselves without requiring help from programmers. This self-service capability is a core reason for Excel’s massive success in the enterprise. It means business users don’t have to wait for IT to produce a solution that probably doesn’t solve their problem.
- Reports can be completely live, functioning as dashboards that show business activities in real-time. In some applications, these can replace custom AJAX solutions at a fraction the programming effort.
Disadvantages:
- This also represents a classic nightmare for enterprises in which business rules are locked up in a spreadsheet with no oversight or transparency.
- Active spreadsheets only function when they have connectivity.
- The spreadsheet provides no shared view of the data.
- All coding is in VBA, a language unfamiliar to most programmers. VBA also lacks some of the tooling on which most delivery processes require (e.g., it is not friendly to source code control).
Generate CSV files from data and import them into Excel
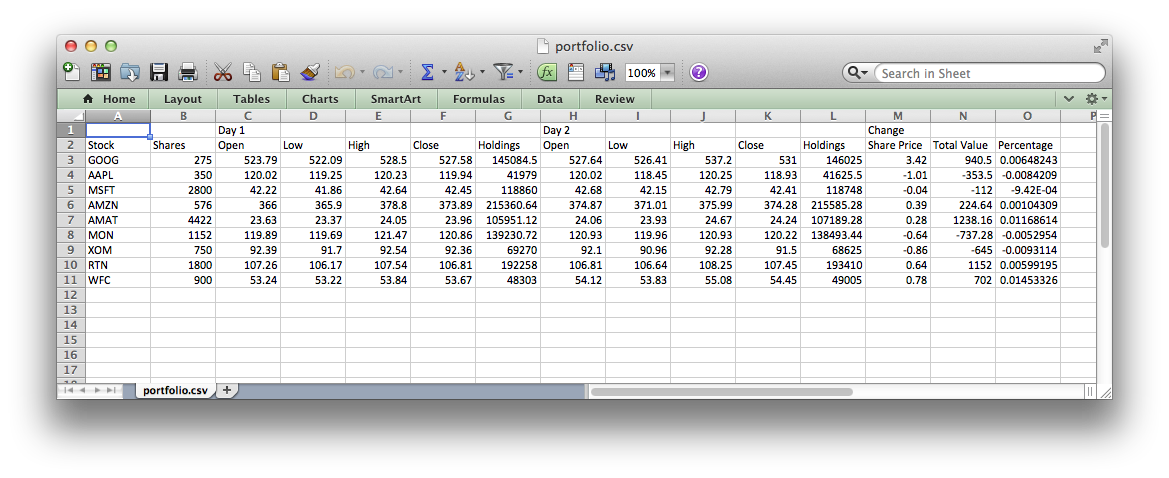
It’s easy for programmers to generate comma separated value (CSV) files and Excel can import them easily.
Creating this is trivial:
1 2 3 4 5 6 7 8 9 10 11 | |
And it can be opened in Excel directly:
While speaking to the San Francisco Clojure Meetup last week, I asked the group how they produced data for Excel users and I got a loud chorus of “CSV!”
Advantages:
- This is by far the easiest for programmers. They don’t need to think about Excel at all. At its simplest, the report can just be the output of a SQL query.
- CSV is not target-specific. In addition to Excel, the resulting data can be loaded into statistical packages like R, directly into databases, or easily into programs written in almost any programming language.
Disadvantages:
- CSV doesn’t support formatting at all. All data imported into Excel will be in its rawest form. For example, even if your program produces numbers with two digits after the decimal point, Excel will drop the trailing zeros using its basic number format.
- Forcing an import operation is actively user-hostile. To read a CSV file, Excel users need to walk through a multi-dialog wizard and then they’ll often need to do some formatting in Excel just to render the data intelligible at all. This isn’t too bad to consume some data that you only get once, but, for example, a weekly report creates a substantial repeating burden on the receiver(s).
- CSV format doesn’t support formulas. This means that if data in one part of the report is derived from other data, there is no way for the receiver of the report to see that relationship.
- A CSV file can only represent a single sheet of data. This is problematic in many reports where you want to present a group of related tables.
Generate Excel files programmatically
Using the Apache POI library, programs written in any of the JVM languages can generate Excel reports that use all the features of Excel. This makes it possible to generate reports that have all the richness of hand-created spreadsheets.
Advantages:
- The resulting reports can be very well designed for communicating the information they present.
- Programmers can code in the language they know, using the same tools they use for the rest of their server-side development.
Disadvantages:
- Programmers cannot access the point-and-click tools that users normally use to format spreadsheets. All formatting needs to be explicitly coded.
- The design of the interface complects data with presentation. This can reduce the clarity of the program generating the report.
What we wish for is a way to format our data using Excel’s powerful tools but use data created by our normal programming languages.
An Aside: Content and Layout on the Web
This all recapitulates a story that programmers should be familiar with: creating content for the Web.
The approaches taken above correlate to solutions to server-side content creation such as Cold Fusion, CGI scripts and Active Server Pages (ASP).
Across the evolution of web authoring, new tools have been developed that can separate the data in dynamic web pages from the structure and format of the pages.
I really enjoy Christophe Grand’s Enlive library. Enlive is a library that transforms one or more pure HTML template files into a target page by applying a set of transformation functions. These functions can identify sections of the input templates to operate on using selectors like those in CSS.
The following example shows how the Clojure autodoc tool uses nested functions and selectors to generate the right sidebar table of contents for pages in the official Clojure API documentation, such as the one for clojure.java.io.
First we have a very simple HTML template for this part of the page:
1 2 3 4 5 6 7 8 9 10 11 12 | |
And then the Clojure code that operates on that template to generate the resulting table of contents sidebar:
1 2 3 4 5 6 7 8 9 10 11 12 13 14 15 16 17 18 19 20 21 22 23 24 25 26 27 | |
The details here aren’t important to this discussion, rather the thing to note is the way selectors, like [:.toc-entry], specify parts of the structure of the template and functions get applied to that part, possibly modifying it, duplicating it, or deleting it.
This is a great model for operating on Excel spreadsheets. Because of the structure of the spreadsheet and the underlying file format, it’s difficult to do the kind of invasive templating that we do for HTML with systems like ASP or mustache. The Enlive model works quite well, however, because it’s easy to use “selectors” consisting of worksheet, row, and column locations.
Generating Excel Spreadsheets Using Templates
To put these ideas into practice, I developed the excel-templates library in Clojure.
In this section, I’ll show the library in action creating a spreadsheet that shows the day over day performance of a small stock portfolio. The example itself is on GitHub (here) and you can follow along directly in the source file, portfolio.clj.
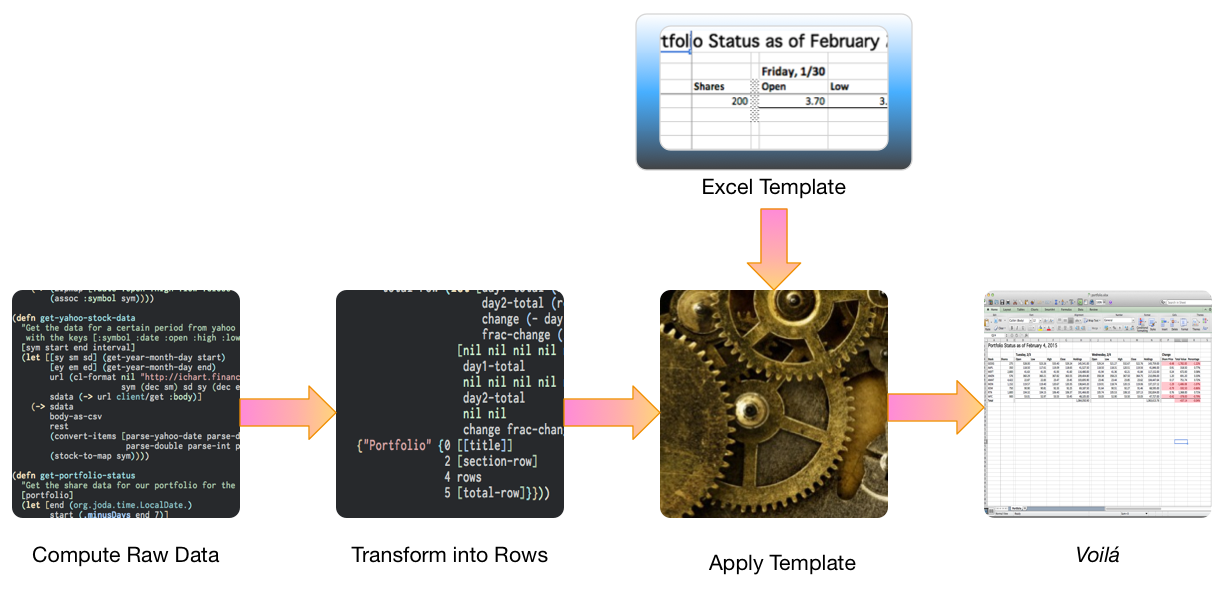
Creating a spreadsheet using excel-templates involves three steps: get all the data, arrange the data into a nested map structure that describes where the various data items should end up, and apply the template to the data.
In code, this is simply:
1 2 3 4 | |
The example uses a simple portfolio defined in a map:
1 2 3 4 5 6 7 8 9 10 | |
Retrieving the data (potentially from multiple sources) is very application-specific. In this case, I use clj-http to retrieve data for each stock from Yahoo Finance as CSV data that I then split into fields (the data is simple enough that we don’t need to worry about quoting and escaping). I pull back data over the past week assuming that that way we’ll always get at least two days in which the markets were open.
Using that raw source data, I build a sequence of maps each of which includes the ticker symbol, the number of shares owned, and the results from each of the last two days.
The Excel template is a pure Excel file that has formatting for each type of row:
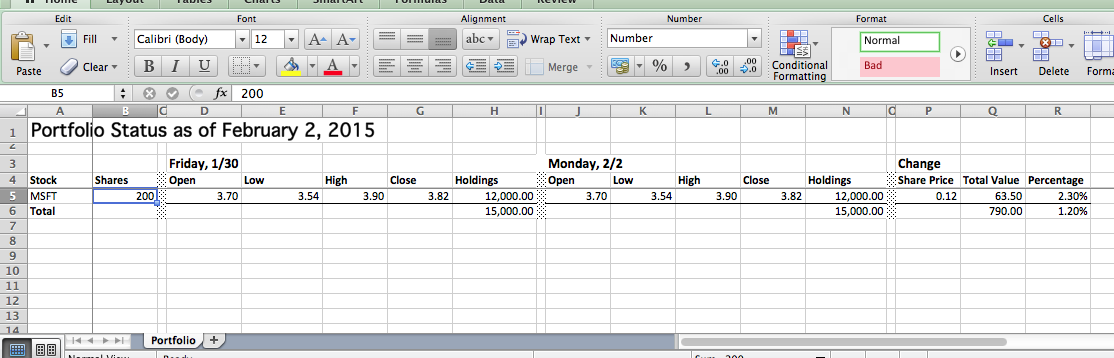
The template for the example is in resources/ (the file can be viewed here), but more generally the template can be in any file or resource that can be opened with clojure.java.io/reader.
The data must be organized into the form that fits your template. This is the only part of your program that needs to be aware of the output at all.
The structure here is simple:
- A top level map has an entry for each worksheet that maps the worksheet name to the data for that worksheet. In the example, we have a single worksheet called “Portfolio”.
- Worksheet data consists of a map that has an entry for each row in the template that gets data. The row number of the template (minus 1 to make the index zero-based) is the key.
- The data for the template row is a sequence of zero or more output rows. If there are zero elements in the sequence, the row from the template is not copied to the output. Otherwise that template row is copied to the output spreadsheet once for each element of the sequence.
- Each output row is itself a sequence describing the data to use to replace the dummy data in the template, column-wise starting on the left. If there are nils in the sequence, the original data from the template is used. The formatting for each cell is always copied from the template.
- Any rows in the template that aren’t mentioned in the data are simply copied to the output.
In my portfolio example, I start with a helper function that builds a map that contains the date of the first market day, the date of the second market day, and the row data for each stock in the portfolio. The dates will be used in the headers and the row data forms the meat of the spreadsheet, replacing row 5 in the spreadsheet with a single row for each stock.
This function is pretty straightforward:
1 2 3 4 5 6 7 8 9 10 11 12 13 14 15 | |
Then to construct the full data structure, I compute the header and total information and combine it with the main rows and return it as a map in the form mentioned above:
1 2 3 4 5 6 7 8 9 10 11 12 13 14 15 16 17 18 19 20 21 22 | |
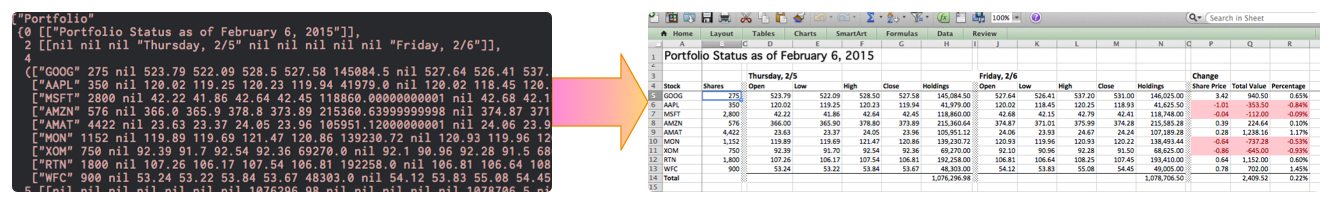
The resulting data structure looks like this:
1 2 3 4 5 6 7 8 9 10 11 12 13 14 | |
Finally, we apply the template to this structure to yield the output spreadsheet. This process is simple since the library does all the work. To do it, I simply pass the input template, output file, and the data I created above to the render-to-file function:
1 2 3 4 5 6 7 | |
The output file is created with the fresh data retrieved live from Yahoo Finance and the formatting from our template without a single line of Excel aware code:
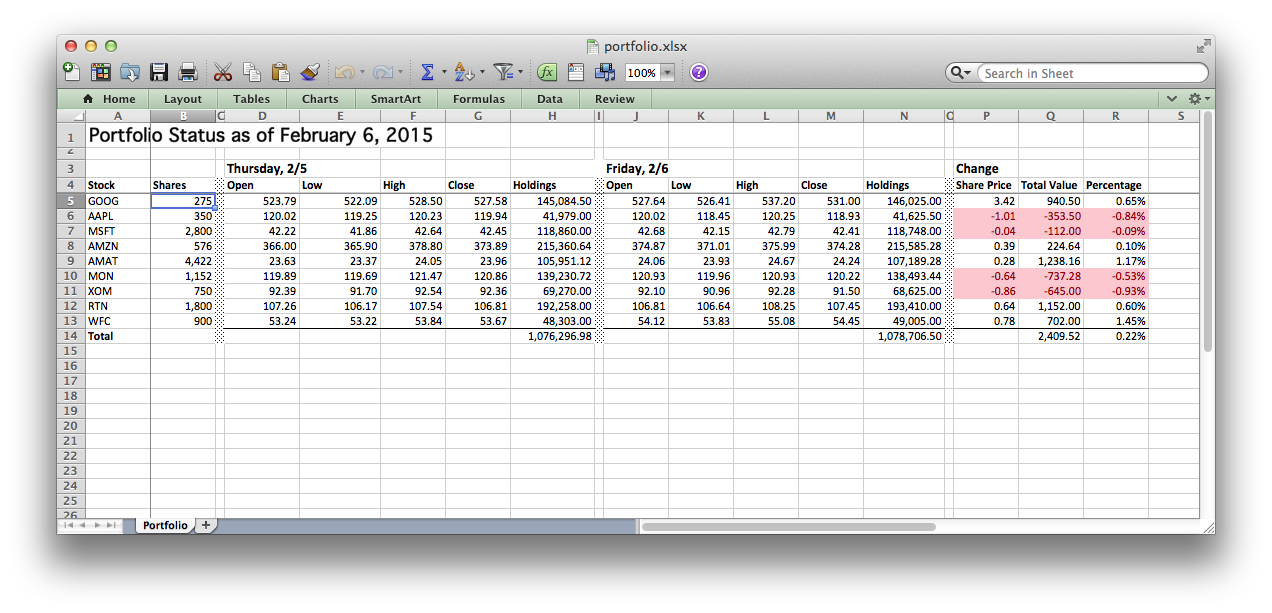
Note, in particular, how we can use conditional formatting to highlight the stocks that decreased in value between those two days.
Limitations and Future Work
While Excel Templates is already mature and has been in production use within Staples since late 2014, it lacks some desirable features that make great candidates for continuing development:
No formula rewriting. As I mentioned above, one of Excel’s biggest advantages is transparency, the ability to see which values are computed from other values by directly examining the formulas. Unfortunately, Excel Templates doesn’t rewrite formulas to reflect changes to the templates when rows are expanded so it’s impossible to use explicit formulas in many cases. In the portfolio example above, formulas could have been used within the lines (for total holdings and changes) and for the totals.
While in this case the derivation of these values is well understood, in many cases formulas can provide invaluable documentation to an analyst receiving a spreadsheet. This has been my exact experience when producing spreadsheets that had a one-to-one mapping between template rows and output rows, thus allowing me to use formulas for all derived values.
Additionally, formula rewriting would allow for much better use of graphs and charts in the templates.
Only works on rows. Using excel templates, it’s easy to expand a single row in the template into multiple rows in the output creating an attractive report that goes down the page. However, it’s simply not possible to do the same thing across the page. In many scenarios, putting comparable data in adjacent columns is a superior way to present the data, especially when the total number of columns will be reasonably modest.
There should be nothing too difficult about adding this method to Excel Templates. The interesting challenge lies in how you express multiple approaches in the input data.
The ability to use named regions in the template as sources seems like a good way to abstract the generated data away from the structure of the spreadsheet, similar to the way we use classes and IDs in HTML, but I’m not sure if it would be that valuable in practice.
One-to-one correspondence of input and output worksheets. It would be nice to support the creation of related worksheets in a workbook from a single worksheet template. This was suggested when I presented the library at the SF Clojure Meetup and I think it’s a great idea.
I’d be happy to discuss contributions of any of these or in other areas where the library could be improved. Just open an issue on GitHub.
Acknowledgments
This work was originally done as part of a project at Staples SparX and I’d like to thank them for their support and ideas as well as permission to open source the results so the community can share the benefits.
Also, thanks to Jeb Beich for his reviews and contributions to the project.